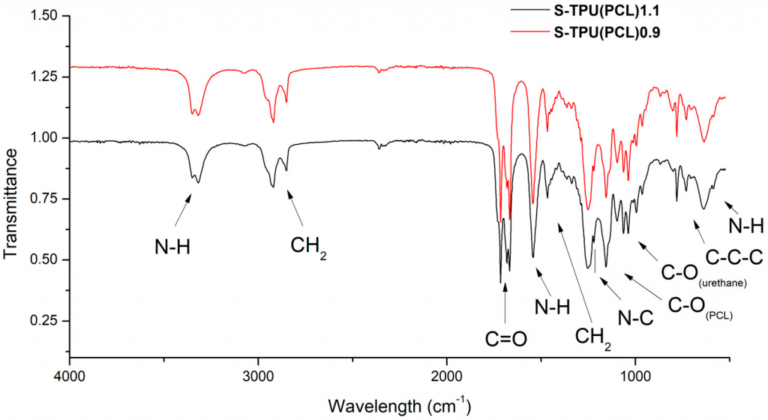
The shifts in band positions between the second derivative and curve fitting of Fourier transform infrared (FTIR) spectra can occur due to several reasons, including noise, baseline variations, and spectral artifacts.
When performing the second derivative analysis of an FTIR spectrum, the derivative operation amplifies the noise in the original spectrum. This can cause distortions or shifts in the band positions, which can lead to inaccuracies in the peak assignments. In addition, baseline variations and spectral artifacts can also affect the accuracy of the second derivative analysis, leading to shifts or distortions in the peak positions.
Curve fitting, on the other hand, can be a more accurate method for determining the peak positions and intensities in an FTIR spectrum. This method involves fitting a mathematical function to the raw spectrum to extract the peaks and baseline information. Curve fitting can be less sensitive to noise and baseline variations than second derivative analysis, resulting in more accurate peak assignments.
However, curve fitting can also have limitations. The choice of mathematical function can affect the accuracy of the peak assignments, and the number of peaks and their positions can depend on the initial parameters used in the fitting. In addition, curve fitting can be time-consuming and require significant computational resources.
Overall, both second derivative and curve fitting methods can be useful for analyzing FTIR spectra, but it is important to be aware of their limitations and potential sources of error. It is often recommended to use multiple analysis methods to cross-validate the results and increase confidence in the peak assignments.


