Our scientists interpret your data and lab results
Analyst
What is analysis of FTIR and how does it work?
Fourier Transform Infrared (FTIR) spectroscopy is a powerful analytical technique used to identify and characterize chemical compounds. It is a non-destructive technique that works by measuring the absorption or transmission of infrared radiation as it passes through a sample. FTIR spectroscopy is widely used in a range of fields, including chemistry, biology, pharmaceuticals, and material science.
FTIR spectroscopy works on the principle that every chemical compound has a unique molecular structure, which results in specific vibrational modes that can be detected by infrared radiation. When a beam of infrared light passes through a sample, some of the radiation is absorbed by the sample’s molecules, causing the molecules to vibrate. The energy of the absorbed radiation corresponds to the specific vibrational modes of the molecule, resulting in a unique infrared spectrum that can be used to identify the sample.
FTIR spectrometers consist of three main components: a source of infrared radiation, a sample holder, and a detector. The source of infrared radiation is usually a heated filament or a laser, which emits a beam of radiation that is passed through an interferometer. The interferometer separates the radiation into different frequencies and then recombines the frequencies, resulting in an interference pattern that is detected by the detector.
To perform an FTIR measurement, a small amount of the sample is placed on a sample holder and then inserted into the FTIR spectrometer. The infrared radiation passes through the sample, and the resulting absorption spectrum is recorded by the detector. The spectrum is then analyzed to identify the functional groups and chemical bonds present in the sample.
FTIR spectroscopy is a powerful technique for the identification and characterization of chemical compounds. It can be used to determine the chemical composition of a wide range of samples, from simple organic compounds to complex biological molecules. FTIR spectroscopy is also widely used in quality control and process monitoring in industries such as pharmaceuticals, polymers, and food production.
How can FTIR be used for the identification of unknown compounds?
FTIR spectroscopy is an excellent technique for the identification of unknown compounds, and it is widely used in the fields of chemistry, biology, and material science. There are several ways in which FTIR can be used to identify unknown compounds:
FTIR spectral databases: One of the most common ways to identify an unknown compound using FTIR is to compare the sample’s spectrum to a spectral database. There are several databases available, such as the NIST (National Institute of Standards and Technology) database, which contains a large collection of FTIR spectra of known compounds. By comparing the sample’s spectrum to those in the database, it is possible to identify the functional groups and chemical bonds present in the sample, and therefore determine the compound’s identity.
Functional group analysis: FTIR spectra contain peaks that correspond to the absorption of infrared radiation by specific chemical functional groups. By analyzing the peaks present in the sample’s spectrum, it is possible to determine the functional groups present in the compound. This information can be used to narrow down the possible identities of the unknown compound.
Derivative spectroscopy: Derivative spectroscopy is a technique that involves taking the first or second derivative of the FTIR spectrum. This technique can be useful for identifying weak or overlapping peaks in the spectrum, which may be difficult to identify using standard FTIR spectroscopy.
Microspectroscopy: Microspectroscopy is a technique that allows FTIR spectra to be obtained from very small samples, such as individual cells or subcellular structures. This technique can be particularly useful for identifying unknown compounds in biological samples.
FTIR spectroscopy is a powerful technique for the identification of unknown compounds. By analyzing the functional groups present in a sample, comparing the sample’s spectrum to a spectral database, or using derivative or microspectroscopy techniques, it is possible to determine the identity of an unknown compound with a high degree of accuracy.
Step-by-step Analysis of FTIR
Here is a step-by-step guide to interpreting FTIR results:
1. Identify the functional groups: In order to interpret FTIR results, you must first identify the functional groups present in the sample. This is done by examining the peaks on the FTIR spectrum, which correspond to the absorption frequencies of the bonds in the sample. The location and intensity of each peak correspond to the concentration of the functional group in the sample.
2. Compare the spectrum to a reference spectrum: Once you have identified the peaks on the FTIR spectrum, you can compare the spectrum to a reference spectrum of known compounds to determine the identity of the functional groups present. This can be done using specialized software or by visual inspection of the spectra.
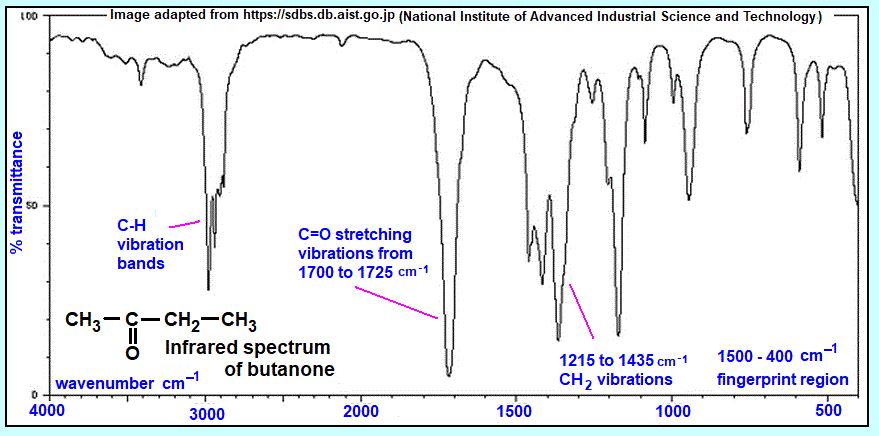
3. Analyze the peaks: Each peak on the FTIR spectrum corresponds to a particular vibrational mode in a molecule. Analyzing the position and shape of the peaks can provide information about the identity and structure of the compound. For example, a peak at 1700 cm-1 may indicate the presence of a carbonyl group, while a peak at 3300 cm-1 may indicate the presence of an O-H or N-H bond.
4. Consider the overall spectrum: In addition to analyzing individual peaks, it is also important to consider the overall shape of the FTIR spectrum. For example, a broad peak in the region of 3300-3500 cm-1 may indicate the presence of O-H or N-H stretching, while a sharp peak in the region of 1700-1750 cm-1 may indicate the presence of a carbonyl group. The shape of the baseline and the presence of background noise should also be taken into consideration.
5. Interpret the results in context: Finally, it is important to interpret the FTIR results in the context of the specific experiment or analysis being performed. For example, if you are analyzing a mixture of compounds, the spectrum may be more complex and require additional analysis to identify individual functional groups or compounds. Additionally, the type of sample preparation or analysis may affect the FTIR results, so it is important to take these factors into account when interpreting the results.
Next we will shine more light on each step and give examples.
We work on your data to interpret and extract useful information!
Why Choose Us?
- 24/7 Service
- Accurate Analysis by Expert Scientists
- Free revisions After Completion of Orders
- Guaranteed Satisfaction
- Affordable Price
Identify the functional groups:
Functional group analysis is one of the primary ways to identify the presence of specific chemical functional groups in a sample using FTIR spectroscopy. FTIR spectra contain characteristic peaks that correspond to the absorption of infrared radiation by different chemical functional groups. By analyzing the peaks present in the sample’s spectrum, it is possible to determine the functional groups present in the compound.
To identify functional groups by FTIR, a few key steps need to be taken:
Sample preparation: A small amount of the sample must be placed on a sample holder and then inserted into the FTIR spectrometer. The sample should be uniformly distributed over the sample holder to ensure accurate measurement.
Spectrum acquisition: The FTIR spectrometer is used to obtain the infrared spectrum of the sample. This is done by passing infrared radiation through the sample and measuring the amount of radiation absorbed by the sample.
Spectral interpretation: The FTIR spectrum is analyzed to identify the functional groups present in the sample. The first step is to look for broad bands in the spectrum, which are typically associated with the presence of functional groups such as O-H, N-H, and C-H. These bands are usually located in the range of 4000-1400 cm-1.
Fine structure analysis: Once the broad functional groups are identified, the spectrum is analyzed for fine structure features, which correspond to specific functional groups. For example, the C=O stretching vibration of a carbonyl group typically appears as a sharp peak between 1750 and 1650 cm-1. Similarly, the N-H stretching vibration of an amine group appears as a sharp peak around 3300 cm-1.
Identification of unknown functional groups: By comparing the spectrum of an unknown sample to a reference spectrum database, it is possible to determine the functional groups present in the sample. Additionally, other techniques such as derivative spectroscopy or microspectroscopy can be used to identify weak or overlapping peaks in the spectrum.
FTIR spectroscopy is an excellent technique for the identification of functional groups in a wide range of chemical compounds. By analyzing the spectrum of the sample, it is possible to identify the presence of specific functional groups, which can be used to determine the identity of the compound.
Compare the FTIR spectrum to a reference spectrum
One of the primary ways to identify unknown compounds using FTIR spectroscopy is by comparing the FTIR spectrum of the unknown compound to a reference spectrum. A reference spectrum is a collection of spectra from known compounds that can be used as a standard for comparison. There are several databases available, such as the NIST (National Institute of Standards and Technology) database, which contains a large collection of FTIR spectra of known compounds.
To compare the FTIR spectrum to a reference spectrum, the following steps should be taken:
Sample preparation: A small amount of the unknown sample is placed on a sample holder and then inserted into the FTIR spectrometer. The sample should be uniformly distributed over the sample holder to ensure accurate measurement.
Spectrum acquisition: The FTIR spectrometer is used to obtain the infrared spectrum of the unknown sample.
Spectral comparison: The FTIR spectrum of the unknown sample is compared to the reference spectra in the database. This can be done using specialized software that allows for side-by-side comparison of spectra.
Spectrum interpretation: The spectra are analyzed for similarities and differences. Specific peaks and functional groups that appear in the unknown sample’s spectrum can be compared to those in the reference spectra to determine the identity of the unknown compound.
Identification of unknown compounds: By comparing the unknown sample’s spectrum to a reference spectrum, it is possible to determine the identity of the unknown compound. This can be done by finding the best match for the unknown spectrum in the reference spectra database.
Validation of identification: Once a match is found, it is important to validate the identification of the unknown compound by comparing the unknown sample to additional reference spectra and/or by using other analytical techniques.
Comparing the FTIR spectrum of an unknown compound to a reference spectrum is an effective way to identify the compound. By analyzing the spectra for similarities and differences, it is possible to determine the identity of the unknown compound. FTIR spectral databases are a valuable tool for identifying unknown compounds and can be used in a wide range of fields, such as chemistry, biology, and material science.
Analyze the FTIR peaks:
Analysis of FTIR peaks is a critical step in interpreting FTIR spectra. The peaks in an FTIR spectrum correspond to the absorption of specific frequencies of infrared radiation by chemical bonds present in the sample. By analyzing the position, intensity, and shape of these peaks, it is possible to gain valuable information about the molecular structure and composition of the sample. Here are some steps for analyzing FTIR peaks:
Identify functional groups: The first step in analyzing FTIR peaks is to identify the broad functional groups present in the sample. These functional groups typically appear as broad bands in the spectrum and are associated with the presence of O-H, N-H, and C-H bonds. This information can be used to make an initial identification of the sample.
Identify fine structure features: After identifying the broad functional groups, it is necessary to analyze the fine structure features of the spectrum, which correspond to specific chemical bonds. The position of the peaks provides information about the type of bond present, and the intensity of the peaks provides information about the concentration of the bond.
Peak position: The position of a peak in an FTIR spectrum can provide information about the type of bond present. For example, the C=O stretching vibration of a carbonyl group typically appears as a sharp peak between 1750 and 1650 cm-1. Similarly, the N-H stretching vibration of an amine group appears as a sharp peak around 3300 cm-1. By comparing the position of the peaks in the spectrum to reference spectra, it is possible to identify the type of bond present.
Peak intensity: The intensity of the peaks in an FTIR spectrum provides information about the concentration of the bond. The intensity of the peaks can be used to estimate the relative amounts of different functional groups in the sample. However, it is important to keep in mind that peak intensities can be affected by factors such as sample thickness, particle size, and sample preparation.
Peak shape: The shape of an FTIR peak can provide information about the nature of the bond. For example, broad peaks with rounded shoulders are typical of O-H bonds, while sharp, narrow peaks are more typical of C-H bonds.
Use of software: In modern FTIR spectrometers, specialized software can be used to automate peak analysis of FTIR. The software can help in the identification of the peaks and the calculation of peak intensities.
Analyzing FTIR peaks is a crucial step in analysis of FTIR spectra. By analyzing the position, intensity, and shape of the peaks, it is possible to gain valuable information about the molecular structure and composition of the sample. Careful analysis of FTIR peaks can aid in the identification of unknown compounds, as well as provide insight into the chemical structure of known compounds. To learn more about peak analysis of FTIR click here.
Consider the overall FTIR spectrum
When analyzing an FTIR spectrum, it is important to consider the overall spectrum in addition to individual peaks. The overall spectrum provides valuable information about the composition and structure of the sample, including the presence or absence of specific functional groups, the relative amounts of different chemical groups, and the complexity of the sample. Here are some steps to consider when evaluating the overall FTIR spectrum:
-
Determine the fingerprint region: The fingerprint region of an FTIR spectrum typically ranges from 1500 to 400 cm-1 and is characterized by a complex series of peaks that arise from the bending and twisting vibrations of various functional groups. The fingerprint region is unique to each compound and can be used to identify unknown samples.
-
Look for broad bands: Broad bands in the spectrum can indicate the presence of functional groups such as O-H, N-H, and C-H bonds. These broad bands can provide a rough estimate of the composition of the sample and can aid in identifying the compound.
-
Assess the level of noise: FTIR spectra are susceptible to noise, which can arise from various sources such as sample preparation and instrument settings. A high level of noise in the spectrum can make it difficult to identify specific peaks, and it may be necessary to repeat the measurement or adjust instrument settings.
-
Evaluate the baseline: The baseline of the FTIR spectrum can provide information about the presence of impurities or contaminants. A flat baseline indicates a clean sample, while a wavy or sloping baseline may indicate the presence of contaminants.
-
Compare to reference spectra: When analyzing an FTIR spectrum, it is important to compare it to reference spectra of known compounds. This can aid in identifying the sample and confirming the presence of specific functional groups.
-
Consider sample preparation: The method of sample preparation can affect the FTIR spectrum. Factors such as sample thickness and particle size can alter the intensity and position of specific peaks.
Considering the overall FTIR spectrum is critical in interpreting the results of an FTIR measurement. By evaluating the fingerprint region, broad bands, level of noise, baseline, and comparing the spectrum to reference spectra, it is possible to gain a better understanding of the sample’s composition and structure. Careful attention to sample preparation and instrument settings can also help to ensure that the spectrum is accurate and reliable.
Interpret the FTIR results in context
Interpreting the results of FTIR spectroscopy requires careful consideration of the context in which the measurements were made. FTIR spectroscopy is a powerful analytical tool that can provide information about the composition and structure of a wide variety of materials, but it is important to take into account various factors that can affect the accuracy and reliability of the results. Here are some steps to consider when interpreting the results in context:
Consider the sample preparation: The method of sample preparation can have a significant impact on the FTIR spectrum. Factors such as sample thickness, particle size, and homogeneity can affect the intensity and position of specific peaks. It is important to ensure that the sample preparation is consistent and representative of the material being analyzed.
Take into account the spectral range and resolution: The spectral range and resolution of the FTIR instrument can affect the accuracy and sensitivity of the measurements. It is important to ensure that the spectral range is appropriate for the sample being analyzed and that the resolution is sufficient to resolve the relevant peaks.
Consider the sample matrix: The sample matrix can affect the FTIR spectrum by altering the intensity and position of specific peaks. It is important to take into account the sample matrix when interpreting the results, particularly when analyzing complex mixtures or samples with high levels of impurities.
Use appropriate reference spectra: When identifying unknown samples, it is important to use appropriate reference spectra of known compounds. The choice of reference spectra can have a significant impact on the accuracy of the identification.
Interpret the results in context: FTIR spectroscopy provides valuable information about the composition and structure of the sample, but it is important to interpret the results in the context of the material being analyzed. Factors such as the intended use of the material, its history and source, and any known impurities or contaminants can all affect the interpretation of the FTIR results.
Confirm the results using other methods: While FTIR spectroscopy is a powerful analytical tool, it is always recommended to confirm the results using other methods, such as mass spectrometry or NMR spectroscopy. This can help to ensure the accuracy and reliability of the results.
Interpreting the results of FTIR spectroscopy requires careful consideration of various factors that can affect the accuracy and reliability of the measurements. By taking into account the sample preparation, spectral range and resolution, sample matrix, reference spectra, and context of the material being analyzed, it is possible to gain a better understanding of the composition and structure of the sample.
An example of FTIR analysis
Let’s consider the example of caffeine, a common stimulant found in coffee, tea, and energy drinks. Here are the steps for characterizing caffeine using FTIR spectroscopy:
Sample preparation: To prepare the caffeine sample for analysis of FTIR, we could first grind the solid caffeine to a fine powder using a mortar and pestle. We could then mix the powder with a small amount of potassium bromide (KBr) and press the mixture into a thin, transparent disc using a hydraulic press. The KBr disc serves as a matrix for the caffeine sample and enables the sample to be analyzed using FTIR spectroscopy.
Spectrum acquisition: Next, we would acquire the FTIR spectrum of the caffeine sample using a suitable instrument. The instrument settings would be optimized to ensure that the spectral range and resolution are appropriate for the sample. The sample would be analyzed in transmission mode, with the KBr disc serving as a reference.
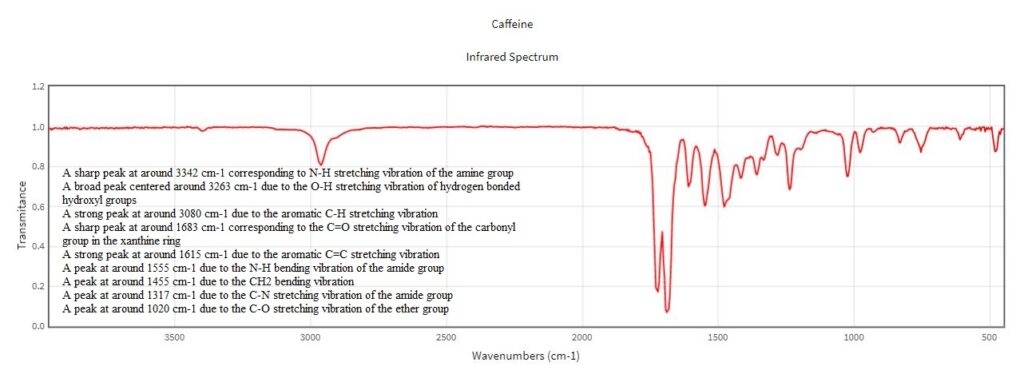
Spectrum analysis: The FTIR spectrum of caffeine would contain numerous peaks that correspond to various functional groups and chemical bonds in the molecule. The first step in analyzing the spectrum would be to identify the characteristic peaks of caffeine. For example, we might observe a sharp peak at around 1680 cm-1, which corresponds to the C=O stretching vibration of the carbonyl group in the xanthine ring of caffeine. We might also observe a peak at around 3250 cm-1, which corresponds to the N-H stretching vibration in the amide group of the caffeine molecule.
Peak assignment: After identifying the characteristic peaks, the next step would be to assign the peaks to specific functional groups or chemical bonds in the molecule. For example, the peak at 1680 cm-1 can be assigned to the carbonyl group in the xanthine ring, while the peak at 3250 cm-1 can be assigned to the amide group. By assigning each peak to a specific functional group or bond, we can gain a better understanding of the molecular structure of caffeine.
Interpretation: Finally, we would interpret the FTIR spectrum in the context of caffeine. We might compare the spectrum to reference spectra of known caffeine samples to confirm the identification and to ensure that the spectrum is consistent with the expected chemical structure of caffeine. We might also consider the overall shape of the spectrum, the intensity of the peaks, and any other relevant features in the context of the intended use of the caffeine sample.
FTIR spectroscopy can be used to characterize caffeine by identifying its characteristic peaks, assigning the peaks to specific functional groups or bonds, and interpreting the results in the context of the sample being analyzed. This process can provide valuable information about the molecular structure and composition of caffeine and can aid in its identification and characterization.
Comparison of the transmission and ATR-FTIR spectra of caffeine
Here is a brief comparison of the transmission and ATR-FTIR spectra of caffeine:
Transmission FTIR spectrum:
In transmission mode, the caffeine sample is placed between two infrared-transparent plates and the IR beam is passed through the sample. The transmission FTIR spectrum of caffeine typically exhibits a number of characteristic peaks, including:
- A sharp peak at around 3342 cm-1 due to the N-H stretching vibration of the amine group
- A broad peak centered around 3263 cm-1 due to the O-H stretching vibration of hydrogen bonded hydroxyl groups
- A strong peak at around 3080 cm-1 due to the aromatic C-H stretching vibration
- A sharp peak at around 1683 cm-1 due to the C=O stretching vibration of the carbonyl group in the xanthine ring
- A strong peak at around 1615 cm-1 due to the aromatic C=C stretching vibration
- A peak at around 1555 cm-1 due to the N-H bending vibration of the amide group
- A peak at around 1455 cm-1 due to the CH2 bending vibration
- A peak at around 1317 cm-1 due to the C-N stretching vibration of the amide group
- A peak at around 1020 cm-1 due to the C-O stretching vibration of the ether group
ATR-FTIR spectrum:
In ATR mode, the caffeine sample is placed in contact with a diamond or other high-refractive-index material that is coated with an IR-absorbing layer. The IR beam is directed through the ATR crystal and into the sample, where it undergoes multiple internal reflections before returning to the detector. The ATR-FTIR spectrum of caffeine typically exhibits similar peaks as those in the transmission FTIR spectrum. However, the intensity and shape of the peaks may be slightly different due to the different sample preparation and measurement techniques used.
One advantage of ATR-FTIR spectroscopy is that it requires less sample preparation compared to transmission FTIR, as the sample can be analyzed in its natural form without the need for extensive sample preparation. Additionally, ATR-FTIR is typically faster and more convenient to perform than transmission FTIR. However, one potential disadvantage of ATR-FTIR is that the penetration depth of the IR beam into the sample is limited, which can result in some attenuation of the IR signal and may affect the accuracy of the spectrum.
Both transmission and ATR-FTIR spectroscopy can be used to analyze caffeine and other compounds. The choice of method depends on factors such as the sample type, the required accuracy and sensitivity of the analysis, and the available equipment and resources.
Limited offer: Get your FTIR data analyzed for just $14!
We provide interpretation for raw data obtained from the following analytical methods:
Fourier-transform infrared spectroscopy (FTIR)
Raman Spectroscopy
Inductively coupled plasma (ICP)
UV–visible (UV-Vis) spectrophotometry
X-ray powder diffraction (XRD)
Thermal gravimetric analysis (TGA)
Vibrating-sample magnetometer (VSM)
Electrochemical Impedance Spectroscopy (EIS)
Scanning Electron Microscopy (SEM)
Transmission electron microscopy (TEM)
Energy Dispersive X-ray Spectrometry (EDS)

We can help you with your FTIR data analysis!
Please fill out the form below, and we will contact you shortly!
Discounts are available to qualified students and educators!